Our Environmental Protection Initiatives and Climate Change Response
In line with its management philosophy, “Peace of mind, forever,” Meiji Yasuda considers the preservation of the Earth on which people can live with peace of mind to be a universal and crucial issue for humanity. Accordingly, we have positioned “Protect the environment and combat climate change” as a priority issue that must be addressed in order to create social value from standpoints of both a business operator and an institutional investor and contribute to the creation of a sustainable society.
Group Environmental Policy(PDF 153KB)
Our response to recommendations from the TCFD and TNFD*1
Today, global warming, climate change and the loss of natural capital*2 and biodiversity have begun affecting our economic and social activities. These problems call for urgent response in countries around the world. This is why Meiji Yasuda has positioned “Protect the environment and combat climate change” as a priority issue.
Meiji Yasuda is striving to ensure that every aspect of its business operations harmonizes with the global environment in line with its Group Environmental Policy, which defines its stance to environmental protection initiatives. From the standpoints of both a business operator and an institutional investor, efforts are now under way to step up our relevant initiatives.
In addition, we consider appropriate information disclosure pursuant to international standards to be an integral part of these initiatives. Accordingly, in January 2019 we declared our support for recommendations from the TCFD (dissolved in November 2023 and taken over by the IFRS). In June 2023, we also participated in the TNFD forum and, in November of the same year, we were registered as a “TNFD Adopter” who declared its commitment to undertaking information disclosure in accordance with the TNFD recommendations. Thus, we have been striving to enhance the content of information disclosure in line with these two frameworks.
*1 The Task Force on Climate-related Financial Disclosures, the Task Force on Nature-related Financial Disclosures
*2 Capital consisting of forest, soil, water, air, biological resources and other natural resources
Governance
We have also appointed an executive officer in charge of sustainability management & development, with the aim of strengthening environmental protection, climate change response and other initiatives to contribute to the creation of a sustainable society. At the same time, a general manager position was created and charged with sustainability management & development. Also, the Sustainability Management & Development Committee was formulated as an advisory body to the Management Council, with the Sustainability Disclosure & Climate Change Response Subcommittee operating under said committee. Chaired by the executive officer in charge of sustainability management & development, the Sustainability Management & Development Committee is tasked with discussing climate change-related strategies, risk management, metrics, targets and transition plans as well as policies for sustainability management initiatives while monitoring and reporting the progress of such initiatives to the Management Council and the Board of Directors.
In asset management, we established a general manager position for supervising the Responsible Investment Development in FY2024, with the aim of strengthening our relevant structure under which we promote responsible investment based on our fundamental concept for investment and financing intended to help resolve environmental (E), social (S), governance (G) issues and create a sustainable society.
Risk Management
Meiji Yasuda has defined risks arising from climate change as a “key risk” to be addressed via its framework for enterprise risk management, and we are striving to strengthen our structure for monitoring such risks on both a qualitative and quantitative basis.
Specifically, the Risk Management Control Department is acting in collaboration with relevant departments to identify and assess risks and opportunities arising from climate change, monitor regulatory trends at home and abroad and the status of initiatives undertaken by Meiji Yasuda, and evaluate and verify progress in these initiatives. Findings from the above endeavors are periodically reported to the Management Council and the Risk Management Verification Committee, which serves as an advisory body to the former, so that signs of risks are properly detected and addressed.
Strategy
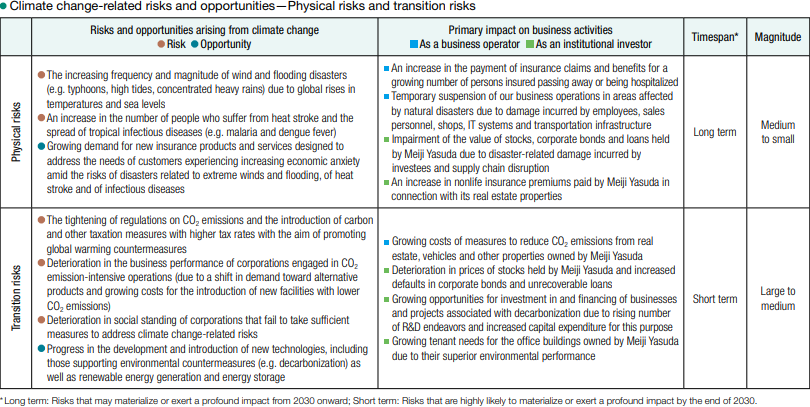
Climate change- and nature-related risks and opportunities
We recognize climate change- and nature-related risks and opportunities as presented in the following chart (items marked with “・”). Moreover, we have conducted scenario analysis associated with climate change-related risks and opportunities from the standpoints of both a business operator and an institutional investor, with results of such analysis featured on the next page.
In addition, the status of natural capital and biodiversity is closely connected to climate change. Accordingly, the TNFD recommends the integrated disclosure of both climate change- and nature-related information. In line with this recommendation, we have organized climate change- and nature-related risks and opportunities in a manner that integrates both.
Climate change-related scenario analysis: TCFD
We conduct scenario analysis to understand the detailed status of climate change-related risks. As a business operator, our scenario analysis focuses on determining the impact of these risks on the amount of death insurance claims and hospitalization benefits to be paid. As an institutional investor, our analysis is aimed at assessing to what extent our investment and financing portfolio will be impacted by these risks.
Scenario analysis refers to the analysis of the impact of climate change on future corporate activities via the use of multiple differing scenarios for climate change.
●Impact on the amount of death insurance claims and hospitalization benefits to be paid
As a business operator, we have analyzed expected growth in the amount of death insurance claims and hospitalization benefits due to global rises in temperatures in light of the relatively high likelihood of this phenomenon compared with other repercussions of climate change.
Based on growing mortality risks arising from higher temperature and severe heat, results of this analysis suggested that a 2°C rise in average temperature will lead to an increase of approximately one billion yen in the payment of death insurance claims, while a rise of 4°C will lead to an increase of around 5 billion yen in the payment of these claims. As for the amount of hospitalization benefits, our analysis forecasts that the payment of hospitalization benefits will grow by about 20 million yen and 70 million yen, respectively, due to a rise of 2°C and 4°C in average temperature, as the growing number of policyholders are expected to be hospitalized to treat heat stroke and other symptoms caused by higher temperatures. It was also confirmed that the financial impact of these rises is limited, considering Meiji Yasuda’s past track record in the payment of these claims and benefits.
However, when it comes to the analysis of the impact of higher temperatures on the amount of death insurance claims and hospitalization benefits, there are no globally agreed-upon methods for carrying out such analysis at present, with various methods now in the process of development. Therefore, we will strive to remain apprised of international trends and maintain collaboration with research institutions and specialist organizations at home and abroad, with the aim of promoting further surveys and analysis.
●Impact on our investment and financing portfolio
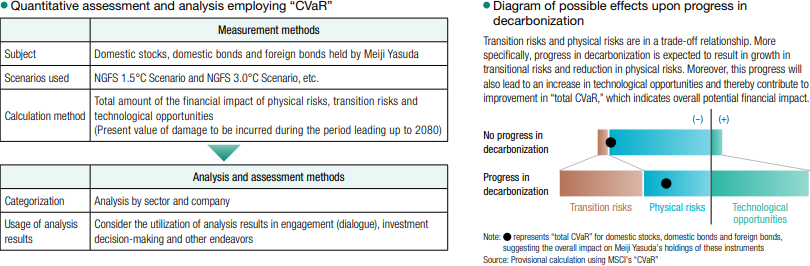
As an institutional investor, we have introduced Climate Value-at Risk (“CVaR”), a tool developed by MSCI, to conduct the quantitative assessment of the impact of climate change on our investment and financing portfolio of domestic and foreign stocks as well as both domestic and foreign bonds.
Leveraging this tool, we are engaged in the provisional calculation and analysis of climate change’s potential financial impact on our investees. Thus far, we have concluded that such impact will be absorbable, given the volume of real net assets possessed by Meiji Yasuda. Methods for analyzing climate change’s impact on the investment and financing portfolio are still in the development phase. Looking ahead, we will continuously update our methods for surveys and analysis.
Meanwhile, the 1.5C° scenario, which pertains to the rise in air temperature from the pre-industrial revolution level, forecasts the materialization of significant transition risks. Under the 3.0°C scenario, the frequency of abnormal weather is expected to grow, with physical risks becoming more profound.
These scenarios thus suggest that transition risks and physical risks are in a trade-off relationship (see Diagram 1 below). In addition, the 1.5 C° scenario anticipates an increase in technological opportunities due to the growing trend toward minimizing carbon emissions.
We have also conducted a sector-based analysis of the impact of climate change on our investment and financing portfolio, targeting investee corporations in Japan. As a result, it was suggested that the impact on the energy, transportation equipment and other sectors that consume massive volumes of fossil fuels will be profound (see Diagram 2 below). We are utilizing results of this and similar analyses to inform our efforts to engage in constructive dialogue with investees.
The analysis of nature-related dependency and impact: TNFD
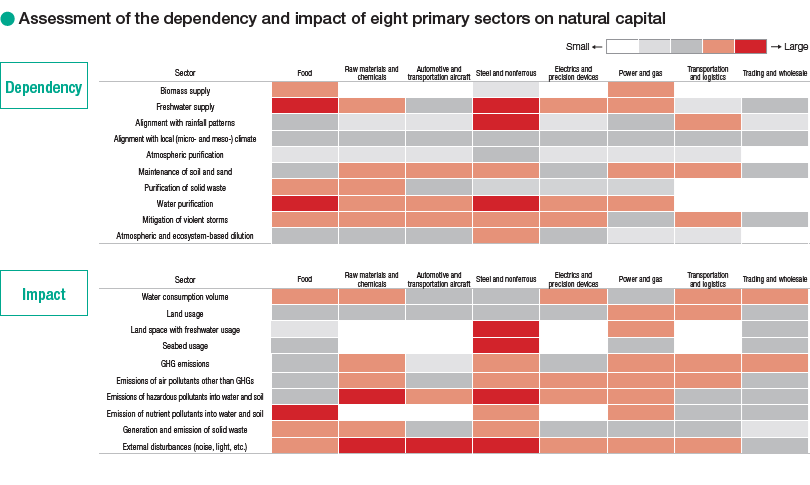
We have also analyzed nature-related risks associated with our investment and financing portfolio. Although our analysis had targeted only domestic stocks until FY2024, we included domestic loans and bonds into the new scope of target assets in FY2025. We also utilized “ENCORE,”* a tool recommended by the TNFD, to conduct a sector-based assessment and evaluate the degree of our portfolio’s dependence on benefits arising from natural capital as well as the degree of its impact on changes in the status of such capital.
Results of this analysis suggested that “Food” and “Steel and nonferrous” are primary sectors with a relatively large degree of dependency and impact while indicating that “Trading and wholesale,” “Electrics and precision devices” and “Power and gas” are primary sectors in which Meiji Yasuda holds relatively large balance of assets. Looking ahead, we will conduct more detailed analysis focused on corporations belonging to these sectors and promote dialogue to encourage them to upgrade their initiatives to protect natural capital and biodiversity as well as their mode of information disclosure.
Also, we assessed the level of the dependency and impact of the eight primary sectors identified via the process described above by taking important types of natural capital for each sector into account. Drawing on the results of this assessment, we will engage in dialogue with each investee corporation to establish a shared recognition of nature-related risks and promote forward-looking initiatives to resolve such issues.
Transition plan
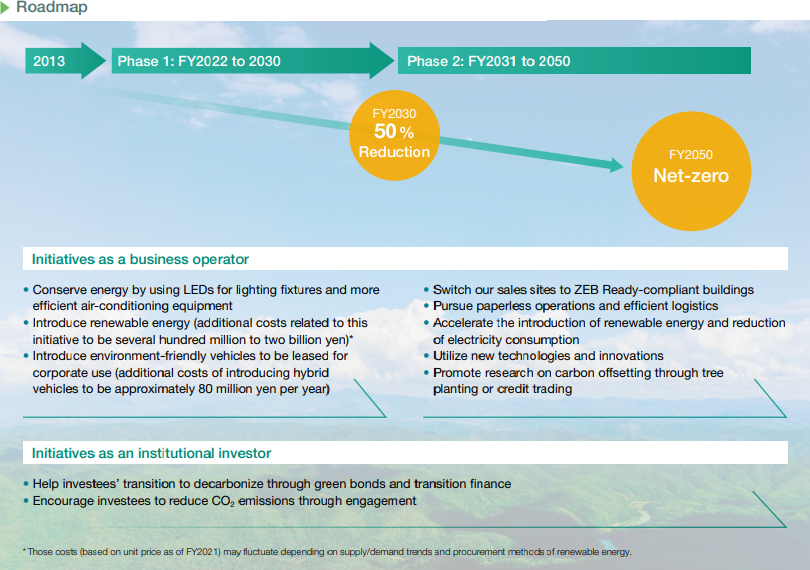
To contribute to the realization of a carbon-free society, we set and announced a target of net-zero CO2 emissions to be achieved in FY2050 and an intermediate target to be achieved in FY2030 from the standpoint of both a business operator and an institutional investor.

Approximately 80% of CO2 emissions currently related to Scope 1 & 2 arise from electricity used in our business activities. Given these factors, as a business operator, we strive for the widespread use of renewable energy for electricity used in our real estate holdings, including three buildings with major Head Office functions.
We are also promoting energy conservation within our company, including the use of LEDs for lighting fixtures and more efficient air conditioning equipment for our real estate holdings.
Furthermore, we will switch our sales sites nationwide to ZEB Ready-compliant buildings at the timing of renovations such as long-term repair. Simultaneously, we will proactively introduce leased vehicles that are eco-friendly.
Taking the expected effect of these initiatives into account, we raised our intermediate reduction target to be achieved in FY2030 for Scope 1 & 2 as a business operator from -50% to -67%. In conjunction with this move, we have accelerated the introduction of renewable energy at our real estate properties and stepped up our other endeavors to reduce the volume of CO2 emissions.
As an institutional investor, we will execute ESG investment and financing aimed at contributing to decarbonization and engage in dialogue with investees on an ongoing basis, with the aim of achieving our target of reducing our portfolio-based emissions by 50% in 2030.
Metrics and Targets
From the standpoints of both a business operator and an institutional investor, we monitor the volume of our CO2 emissions and the status of progress in our initiatives. With regard to our intermediate reduction target to be achieved in FY2030 for Scope 1 & 2 emissions as a business operator, we raised this target to -67% by taking into account progress in the introduction of renewable energies for electricity used in our real estate holdings, such as the Head Office building. (All targets indicate reduction from the level recorded in FY2013.)
- Reduction targets for the volume of CO2 emissions as a business operator
(Scope 1 & 2: Meiji Yasuda Group; Scope 3: Meiji Yasuda, non-consolidated basis)
*6
|
Results for FY2024 |
Targets for FY2030 |
Targets for FY2050 | |
|---|---|---|---|
|
Scope 1 & 2*1 |
-58% |
-67% |
-100% (Net zero emissions) |
|
Scope 3*2 |
-26% |
-40% |
- Reduction targets for the volume of CO2 emissions from portfolio as an institutional investor*3
(Meiji Yasuda, non-consolidated basis)
*6
|
Results for FY2023 |
Targets for FY2030 |
Targets for FY2050 | |
|---|---|---|---|
|
Scope 1 & 2*4,5 |
-49% |
-50% |
-100% (Net zero emissions) |
- The ratio of renewable energy used
- Target: Achieve 100% switchover to renewable energy in terms of electricity used at our domestic business bases by the end of FY2040 (FY2024 results: 39%)
*1 Scope 1 consists of direct emissions from the Company’s activities, such as the use of fuel. Scope 2 consists of indirect emissions attributable to such factors as sources of purchased energy. The scope of calculation comprises Meiji Yasuda Life Insurance Company and its domestic consolidated subsidiaries (Meiji Yasuda General Insurance Co., Ltd., Meiji Yasuda Asset Management Company Ltd. and Meiji Yasuda System Technology Company Limited), as well as its consolidated overseas subsidiaries, namely, Meiji Yasuda America Incorporated, StanCorp Financial Group, Inc. and Pacific Guardian Life Insurance Company, Limited.
*2 Scope 3 consists of indirect emissions attributable to supply chains outside the Company. The above targets for Scope 3 are calculated based only on six categories (1, 3, 4, 5, 6 and 7) in light of their importance. As an institutional investor, the Company manages emissions in category 15 (Investments) separately as emissions from investees.
*3 In April 2025, the Company switched its method for measuring the volume of CO2 emissions from its investment and financing portfolio. The new method is based on the PCAF standard, which provides criteria for measurement methods to be undertaken by financial institutions to assess the volume of CO2 emissions from their investees. Accordingly, the past results presented above, including those for the benchmark year (FY2013), have been retrospectively restated.
*4 Representing reduction targets for Scope 1 & 2 emissions from domestic listed companies we invest in via stock, corporate bonds and other financing.
*5 The volume of emissions in FY2023 as an institutional investor is calculated based on data available as of April 24, 2025.
*6 Results of and reduction plans for the volume of CO2 emissions as a business operator and an institutional investor may be amended due to changes in calculation standards, the scope of calculation, information disclosed by investees and their plans.
Environmental Data
CO2 Emissions from Meiji Yasuda*1
Scope 1&2(t-CO2)
|
Items |
FY2013 |
FY2019 |
FY2020 |
FY2021 |
FY2022 |
FY2023 |
FY2024 |
|
|---|---|---|---|---|---|---|---|---|
|
Scope1 |
Direct emission from using fuel, etc. |
9,208 |
7,161 |
6,226 |
6,450 |
6,583 |
5,735 |
6,703 |
|
Scope2 |
Indirect emissions from purchased energy |
128,756 |
96,230 |
89,821 |
89,086 |
82,056 |
60,617 |
51,905 |
|
Scope 1&2 |
137,964 |
103,391 |
96,047 |
95,536 |
88,639 |
66,352 |
58,608 |
|
Scope 3
|
Items |
FY2013 |
FY2019 |
FY2020 |
FY2021 |
FY2022 |
FY2023 |
FY2024 |
||
|---|---|---|---|---|---|---|---|---|---|
|
Scope3 |
Indirect emissions attributable to supply chains outside the Company |
56,409 |
51,484 |
48,457 |
45,684 |
44,389 |
41,077 |
41,373 |
|
|
Category 1 |
Purchased goods and services |
24,213 |
21,440 |
19,670 |
17,672 |
17,327 |
14,585 |
16,222 |
|
|
Category 3 |
Fuel- and energy-related activities (not included in Scope 1 or 2) |
15,308 |
13,510 |
13,019 |
13,050 |
12,727 |
11,898 |
11,081 |
|
|
Category 4 |
Upstream transportation and distribution |
9,350 |
10,611 |
11,382 |
11,268 |
10,163 |
9,271 |
8,622 |
|
|
Category 5 |
Waste generated in operations |
256 |
213 |
377 |
301 |
413 |
934 |
1,094 |
|
|
Category 6 |
Business travel |
3,512 |
2,433 |
1,191 |
1,065 |
1,553 |
1,937 |
1,991 |
|
|
Category 7 |
Employee commuting |
3,217 |
2,915 |
2,489 |
2,328 |
2,206 |
2,452 |
2,362 |
|
|
Category 8 |
Upstream leased assets |
553 |
362 |
329 |
- |
- |
- |
- |
|
* Indirect emissions from the use of purchased electricity are calculated using the “basic emission factor” until FY2020 and the “adjusted emission factor from FY2021.
・Emissions from the use of commercial vehicle fuel included in Scope 1 are calculated from the total of actual mileage and average fuel consumption.
・Scope 2 is calculated based on purchased electricity and steam consumption, which are subject to the “Act on the Rationalizing Energy Use”. For tenant use of energy in our own buildings, we also include the use of tenants which we have energy management authority under the act.
・Category 1; Activity items subject to calculation are copying paper, brochure etc., which Meiji Yasuda has purchased. The activity amount (printed material cost) multiplied by the emission intensity of “Western paper / Japanese paper” and “Printing / plate making / bookbinding” in the Database.
・Category 3; Activity item subject to calculation is the fuel to produce electricity used in our business. The activity amount (amount of electricity used) multiplied by the emission intensity of “electricity” in the Database at the time of fuel procurement.
・Category 4; Activity item subject to calculation is in-house delivery. The activity amount (delivery cost) multiplied by the emission intensity of “self-transportation (freight vehicle)” in the Database.
・Category 5; Activity item subject to calculation is waste generated from our business. The activity amount (amount of industrial waste discharged) multiplied by the emission intensity of “waste type” in the Database. PCB waste disposal is not inclued in category 5 activities.
・Category 6; Activity item subject to calculation is our employee’s business travel. The activity amount (business trip expense) multiplied by the emission intensity of “transportation method” in the Database.
・Category 7; Activity item subject to calculation is our employee’s commute. The activity amount (commuting expense) multiplied by the emission intensity of “passenger train” in the Database.
・Category 8; Emissions from upstream leased assets have been included in Scope1 since FY2021 due to changes in aggregation methods.
・Category 15; Emissions are disclosed separately as “Emissions from investment and financing.”
CO2 Emissions from Meiji Yasuda Group*2
Scope 1&2(t-CO2)
|
Items |
FY2022 |
FY2023 |
FY2024 |
|
|---|---|---|---|---|
|
Scope1 |
Direct emissions from using fuel, etc. |
8,091 |
7,060 |
7,905 |
|
Scope2 |
Indirect emissions from purchased energy |
84,391 |
61,295 |
52,704 |
|
Scope 1&2 |
92,482 |
68,355 |
60,609 |
|
We use the “emission factors by energy” and “adjusted emission factors by power supplier” published based on the “Act on Promotion of Global Warming Countermeasures” to calculate Scope 1 and 2 emissions.
・Emissions from the use of commercial vehicle fuel included in Scope 1 are calculated from the total of actual mileage and average fuel consumption.
・Scope2 is calculated based on purchased electricity and steam consumption, which are subject to the “Act on the Rationalizing Energy Use”. For tenant use of energy in our own buildings, we also include the use of tenants which we have energy management authority under the act.
Scope 3*3
|
Items |
FY2023 |
FY2024 |
||
|---|---|---|---|---|
|
Scope3 |
Indirect emissions attributable to supply chains outside the Company |
45,007 |
45,371 |
|
|
Category 1 |
Purchased goods and services |
17,811 |
19,527 |
|
|
Category 3 |
Fuel- and energy-related activities (not included in Scope 1 or 2) |
11,996 |
11,171 |
|
|
Category 4 |
Upstream transportation and distribution |
9,271 |
8,627 |
|
|
Category 5 |
Waste generated in operations |
945 |
1,104 |
|
|
Category 6 |
Business travel |
1,989 |
2,044 |
|
|
Category 7 |
Employee commuting |
2,995 |
2,898 |
|
・Category 1; Activity items subject to calculation are copying paper, brochure etc., which Meiji Yasuda Group has purchased. The activity amount (printed material cost) multiplied by the emission intensity of “Western paper / Japanese paper” and “Printing / plate making / bookbinding” in the Database.
・Category 3; Activity item subject to calculation is the fuel to produce electricity used in our business. The activity amount (amount of electricity used) multiplied by the emission intensity of “electricity” in the Database at the time of fuel procurement.
・Category 4; Activity item subject to calculation is in-house delivery. The activity amount (delivery cost) multiplied by the emission intensity of “self-transportation (freight vehicle)” in the Database.
・Category 5; Activity item subject to calculation is waste generated from our business. The activity amount (amount of industrial waste discharged) multiplied by the emission intensity of “waste type” in the Database. PCB waste disposal is not included in category 5 activities.
・Category 6; Activity item subject to calculation is our employee’s business travel. The activity amount (business trip expense) multiplied by the emission intensity of “transportation method” in the Database.
・Category 7; Activity item subject to calculation is our employee’s commute. The activity amount (commuting expense) multiplied by the emission intensity of “passenger train” in the Database.
Environmental performance data by Meiji Yasuda*4
|
Items |
FY2021 |
FY2022 |
FY2023 |
FY2024 |
|
|---|---|---|---|---|---|
|
City gas(thousand m3) |
- |
1,723 |
1,493 |
1,683 |
|
|
A-type heavy oil(kl) |
- |
1 |
1 |
2 |
|
|
LP gas (t) |
- |
19 |
20 |
28 |
|
|
Kerosene(kl) |
- |
71 |
51 |
80 |
|
|
Gasoline(kl) |
- |
1,135 |
1,090 |
1,282 |
|
|
Electricity consumption(MWh) |
191,422 |
186,688 |
179,315 |
179,223 |
|
|
Renewable energy consumption(MWh) |
1,417 |
10,040 |
51,964 |
71,081 |
|
|
Steam(GJ) |
- |
25,587 |
26,196 |
26,975 |
|
|
Hot water(GJ) |
- |
6,807 |
6,713 |
7,626 |
|
|
Cold water(GJ) |
- |
33,915 |
33,991 |
35,704 |
|
|
Water consumption(thousand m3) |
844 |
877 |
845 |
849 |
|
|
Waste generated(t) |
658 |
1,448 |
2,002 |
2,211 |
|
|
Paper consumption(t) |
1,330 |
1,280 |
1,223 |
1,180 |
|
|
Paper recycling volume(t) |
- |
1,670 |
1,948 |
1,886 |
|
・Data on city gas, A-type heavy oil, LP gas, kerosene, gasoline, steam, hot water, cold water, and paper recycling volume has been disclosed starting from the fiscal year 2022.
・Usage amounts of city gas, A-type heavy oil, LP gas, kerosene, electricity, steam, hot water, and cold water are calculated based on the “Act on the Rational Use of Energy” (Energy Conservation Act).
・Gasoline consumption is calculated using the actual driving distance of company vehicles and their average fuel efficiency.
・Renewable energy includes purchased electricity derived from non-fossil fuels and electricity generated by solar power installed on our premises.
・Water consumption is calculated based of the bill from the Water Bureau.
・Waste generated is the amount of waste, as defined in the “Waste Management and Public Cleansing Act”, from business establishments, calculated by aggregating the figures stated in manifests issued based on the Act. PCB waste disposal is not included.
・Paper consumption is calculated by aggregating office paper subject to report in accordance with the “Environmental Reporting Guidelines” from office supplies purchase system data.
・Paper recycling volume includes confidential document recycling.
Environmental performance data by Meiji Yasuda Group*5
|
Items |
FY2022 |
FY2023 |
FY2024 |
|
|---|---|---|---|---|
|
Electricity consumption(MWh) |
186,689 |
180,747 |
180,568 |
|
|
Renewable energy consumption(MWh) |
10,040 |
51,964 |
71,111 |
|
|
Water consumption(thousand m3) |
888 |
855 |
858 |
|
|
Waste generated(t) |
1,470 |
2,039 |
2,243 |
|
|
Paper consumption(t) |
1,295 |
1,239 |
1,196 |
|
・Boundary: Meiji Yasuda and domestic consolidated subsidiaries as Meiji Yasuda General Insurance Co., Ltd., Meiji Yasuda Asset Management Company Ltd., and Meiji Yasuda System Technology Company Limited
・Based on the “Act on the Rationalizing Energy Use”, purchased electricity is calculated based on the bill from suppliers, and soler power consumption is calculated from solar system data.
・Renewable energy includes purchased electricity derived from non-fossil fuels and electricity generated by solar power installed on our premises.
・Water consumption is calculated based of the bill from the Water Bureau.
・Waste generated is the amount of waste, as defined in the “Waste Management and Public Cleansing Act”, from business establishments, calculated by aggregating the figures stated in manifests issued based on the Act. PCB waste disposal is not included.
・Paper consumption is calculated by aggregating office paper subject to report in accordance with the “Environmental Reporting Guidelines” from office supplies purchase system data.
CO2 Emissions from portfolio as an Institutional Investor*4
Scope1・2(kt-CO2)
|
Item |
FY2013 |
FY2020 |
FY2021 |
FY2022 |
FY2023 |
|---|---|---|---|---|---|
|
Scope 1&2*5 |
25,195 |
16,671 |
15,983 |
13,624 |
12,753 |
In April 2025, we changed the method for measuring the CO2 emissions of our portfolio to the PCAF standard, and we are restating past performance figures, including the baseline year (FY2013). *5Covers stocks, corporate bonds, and loans of domestic listed companies
CO2 Emissions Data Collection Date: April 24th, 2025
Detailed Data on CO2 Emissions from investees(PDF 238KB)
Third-Party Assurance
In order to ensure the credibility of our reported data, environmental metrics are assured by an independent third-party organization, as detailed below.
Independent Third-Party Assurance Report(PDF 241KB)
![]() Download the latest version of Adobe Acrobat Reader to view pages from the link marked with
Download the latest version of Adobe Acrobat Reader to view pages from the link marked with